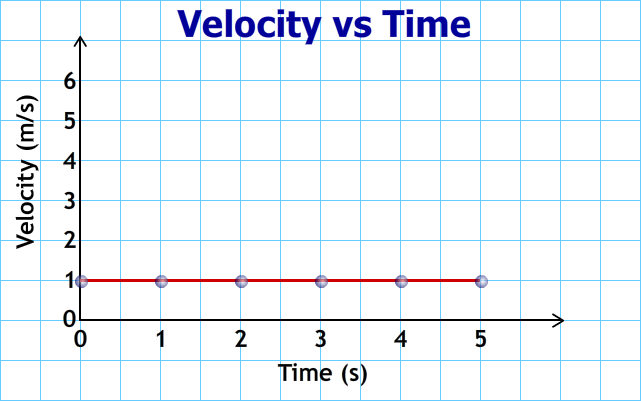
The velocity of the car above is 1 m/s. The velocity is constant. This means that the slope at every dot on the graph's line is the same, 1m/s. At the start, (0 seconds,) the velocity is 1 m/s; at 1 s it is 1 m/s; at 2 seconds it is still 1 m/s; at 3 seconds it remains 1 m/s; at 4 seconds it is still 1 m/s and at 5 seconds it is also 1 m/s. A graph of the slope looks like the one below.
Any time there is a horizontal piece of a velocity vs time graph, this means the object is moving a speed that does not change. Acceleration is defined as how quickly the velocity changes. Mathematically, this is
This means the slope on velocity vs time graph is calculated from the slope.
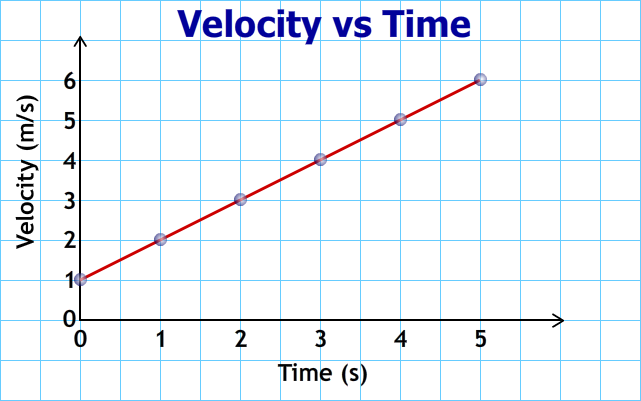
Let's change the situation. Instead of the car traveling at a constant velocity suppose its velocity changes by 1 m/s every second. This is a constant acceleration of 1 m/s2. After 1 second, it would be traveling at 2 m/s; after 2 seconds, it would be traveling at 3 m/s; after 3 seconds it would be traveling at 4 m/s; at 4 seconds the velocity would be 5 m/s, and after 5 seconds it would be traveling at 6 m/s. The graph of the car's velocity would look like the one below.
How to find the displacement from a velocity vs time graph.
On this previous page you learned how to find the displacement from a position vs time graph. Here's how to find the displacement from a velocity vs time graph.
If you were given a graph of velocity vs time, then how would you find the velocity at 5 seconds?
2
Find the velocity at 5 seconds for the velocity vs time graph shown at the right.
3
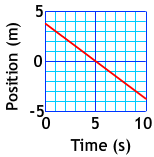
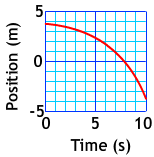
If you were given the graph of position vs time shown at the right, then how would you find the velocity at 5 seconds?
4
For the graph shown at the right, calculate the velocity at 5 seconds. (Hint: The slope is the same at every second along a straight line.)
5
For the graph shown at the right, describe what you need to do to find the velocity at 5 seconds.
6
For the graph shown at the right, calculate the velocity at 5 seconds.
by Tony Wayne ...(If you are a teacher, please feel free to use these resources in your teaching.)
The owner of this website does not collect cookies when the site is visited. However, this site uses and or embeds Adobe, Apple, GoDaddy, Google, and YouTube products. These companies collect cookies when their producs are used on my pages. Click here to go to them to find out more about how they use their cookies. If you do not agree with any of their policies then leave this site now.