This text is meant to accompany class discussions. It is not everything there is to know about energy. It is meant as a prep for class. More detailed notes and examples are given in the class notes, presentations, and demonstrations (click here.)
Law of conservation of energy (for mechanical energies)
The first law of thermodynamics says that all energy is conserved. This is referred to as the law of conservation of energy. This means if you are sitting, at rest, at the top of a playground slide and then slide down to the bottom, all the forms of energy at the top and the bottom of the slide add up to give the same number. It is written like the the line shown below.
If this expression is applied to the slide example above, it would be written as
Since only two forms of energy are being considered, it could further be described as
Example 1
This video shows how to apply the law of conservation of energy to problem solving.
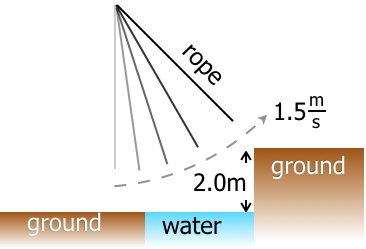
You and a friend are bored. You watched every video of value on YouTube and are looking for something else to do. Outside you see a rope swing hangs from a tall tree. This rope is next to a creek and across from a raised embankment. This could become the first part of a great obstacle course. You get the idea that you can run and grab the rope and swing up to the raised embankment. If you had a velocity of 1.5 m/s when you reach the top then you will be able to continue on the with the obstacle course. But is this feasible? How fast do must you run to swing up the embankment with a final velocity of 1.5 m/s?
The sum of the kinetic and gravitational potential energies at the bottom equals the sum of the kinetic and gravitational potential energies at the top.
You are looking for the velocity at the botom. This is the velocity inside of the kinetic energy formula. At the top of hte swinging motion you know the height and the velocity.
KEbottom + PEbottom = KEtop + PEtop
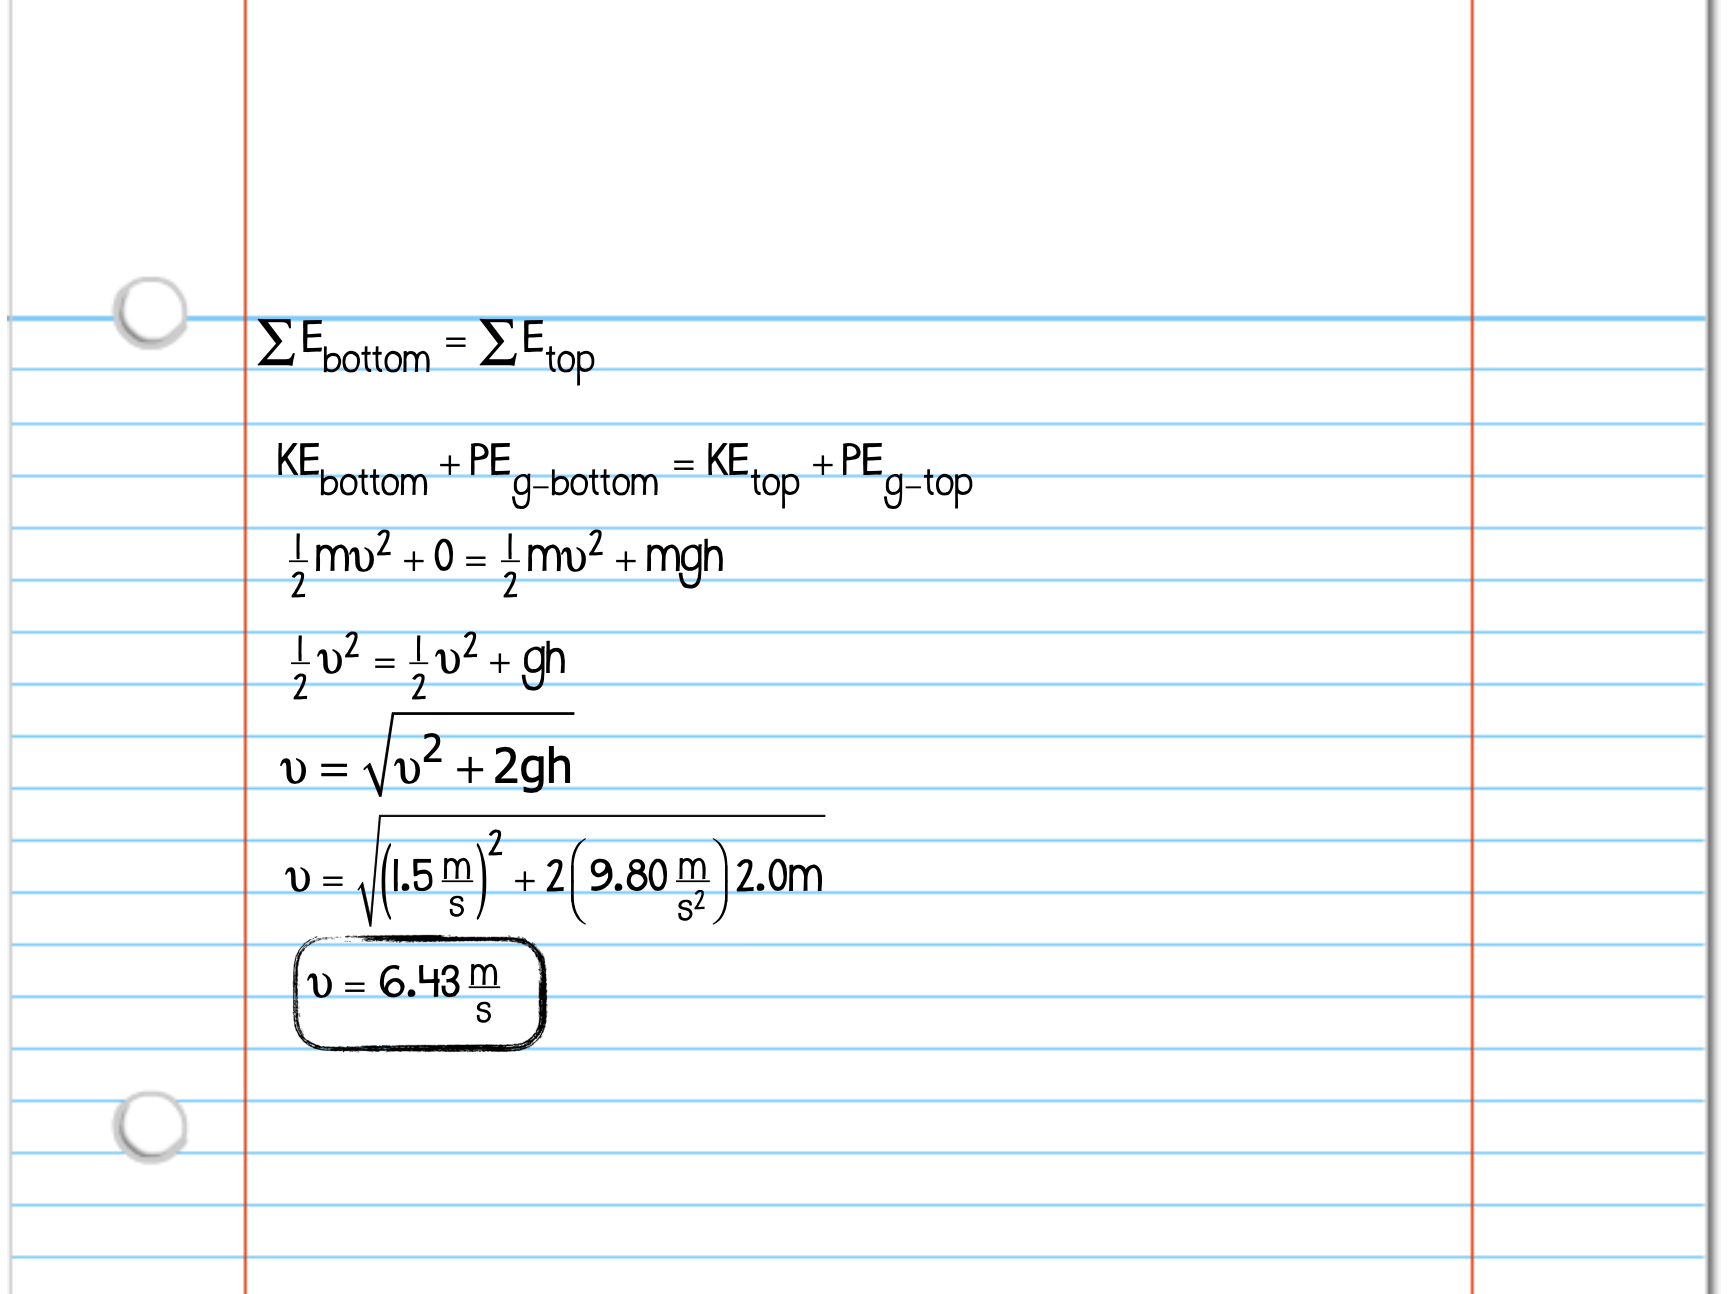
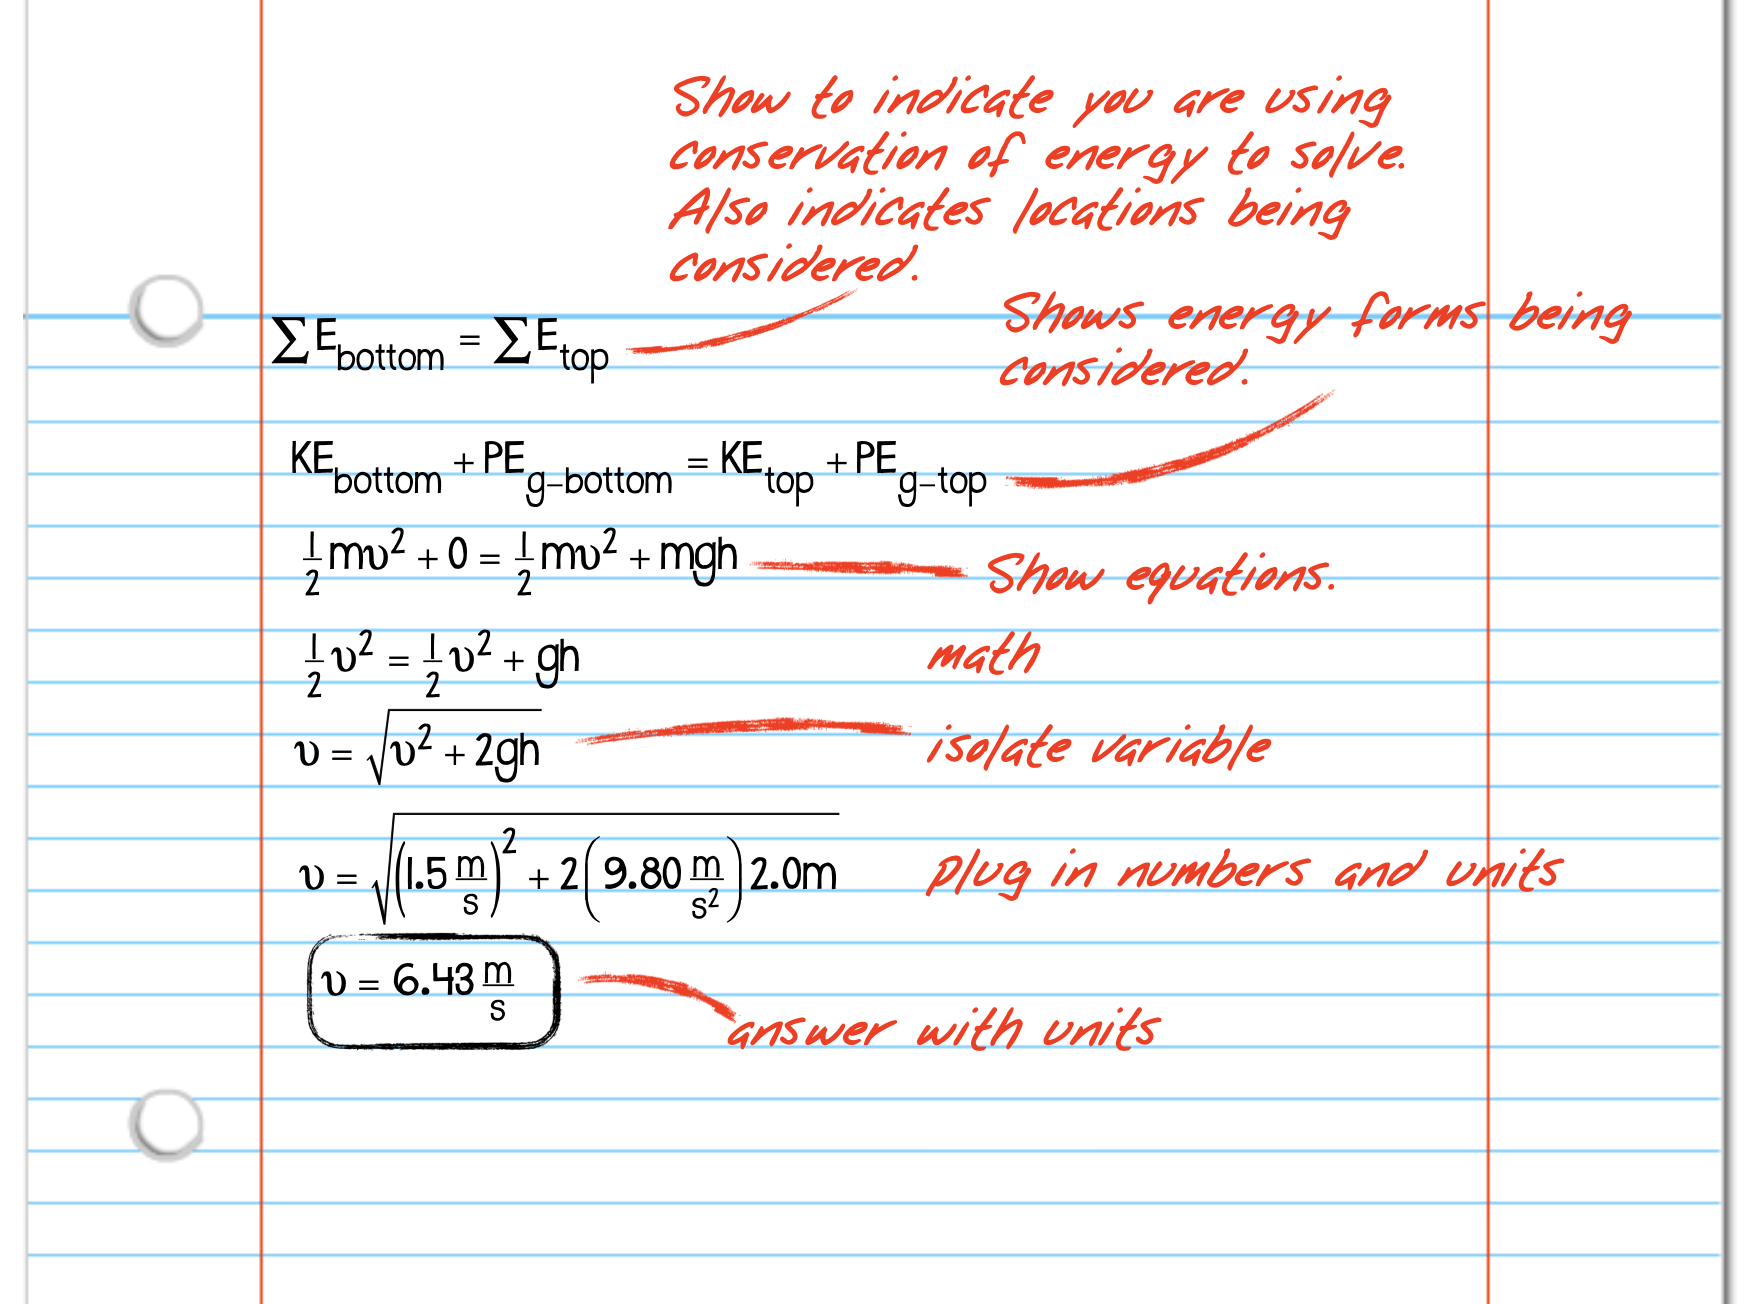
Here's the solution. Below that is the solution with teacher notes as to why you need to show all of these steps.
The second law of thermodynamics (when applied to mechanical energies) says all mechanical energies are not conserved but it can be accounted for by the work of nonconservative forces. Mathematically it looks like this
Where the work is work by nonconservative forces. Conservative forces, such as gravity, springs and other elastic forces, have their own formula for calculating the energy and do not need to be described by these works. Other forces, such as those from motors, rockets, frictions, air resistance, etcetera, are non conservative forces. When work is done by a non-conservative force, energy is either added to subtracted from the body. the energy is accounted for through work.
Example
Earlier you calculated work using the formula "Fd", when given a graph of force vs displacement, work is the area between the curve and the zero axis. When calculating the net work, you add up all the areas for the given displacement while keeping in mind that the areas above the axis are positive and areas below the axis are negative.
Energy Flow Diagrams
An energy flow diagram is a simple bar graph that, describe
s the relative amounts of energy at any location. Through this unit on energy you have seen bar graphs showing different amounts of the forms of energy. If you combine all these bars onto a graph and then create different graphs for each location, then the the collection of graphs are called energy flow diagrams. These diagrams reflect the forms of energy and the law of conservation of energy. The specific length of the bars is not important. What is looked for are the trends in the bars. For example, a car is slowing down and successive energy bar graphs are drawn. As the car slows down the kinetic energy bars also decrease while the energy goes somewhere else. In this car slowing down example, the energy goes into thermal energy.
Below is an example of a collection of energy flow diagrams showing what happens to the rider's forms of energy.
As the snowman travels down the hill he picks up speed. Speed is related to kinetic energy. At the bottom, his kinetic energy, (KE), bar gets bigger. Because he is lower than he started at the bottom of the hill, his potential energy (PE) decreases. That is why that bar is closer to zero. After reaching the bottom the snowman leaves the snow and slides against the ground. The ground slows him down. He loses speed without changing height. The energy goes into thermal energy. It is lost from the system of the sled and hill.
What do you think the energy flow diagram for the animation and the three locations will look like?
Energy flow diagrams can help you understand how energy is transferred from energy form to energy form. The diagrams can be transfered to the math model showing the law of conservation of energy. The diagrams also provide an easy way to conceptually discuss what is happening.
Example
Example
Example
by Tony Wayne ...(If you are a teacher, please feel free to use these resources in your teaching.)
The owner of this website does not collect cookies when the site is visited. However, this site uses and or embeds Adobe, Apple, GoDaddy, Google, and YouTube products. These companies collect cookies when their producs are used on my pages. Click here to go to them to find out more about how they use their cookies. If you do not agree with any of their policies then leave this site now.