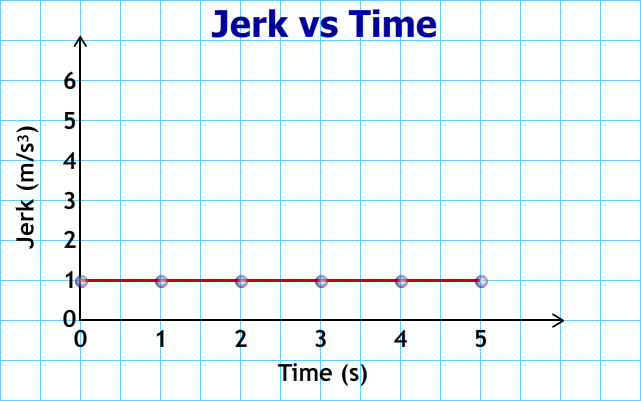
The jerk of the car on the the previous page is 1 m/s3. The jerk is constant. At the start, (0 seconds,) the jerk is 1 m/s3; at 1 s it is 1 m/s3; at 2 seconds it is still 1 m/s3; at 3 seconds it remains 1 m/s3; at 4 seconds it is still 1 m/s3, and at 5 seconds it is also 1 m/s3. The graph will look like the one below.
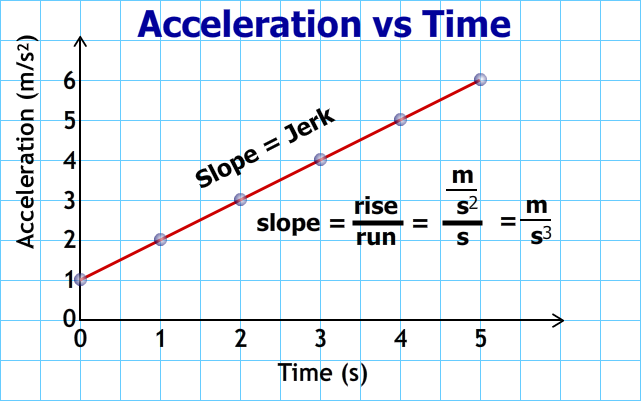
If you been following the previous pages, you will have seen a trend by now. The slope on an acceleration vs time graph is the jerk.
 |
| 1 |
What do you do to calculate the jerk on an jerk vs time graph? |
| |
|
| 2 |
What do you do to calculate the jerk on an acceleration vs time graph? |
| |
|
|
|