- How do you interpret data?
- Include graphs and analysis of graphs as appropriate.
- Show all calculations from graphs as appropriate.
- State the meaning of the slope and discuss the significance of the y-intercept when appropriate.
- Details about using graphs is on this page.

- Calculations for any theoretical values should be neatly shown
- A sample calculation must appear describing the method of obtaining all derived values
- The comparison between experimental results and theoretical values should be done by finding percent errors
- If the results are obtained by two different ways, the comparison should be done by calculating percent differences.
Percent error
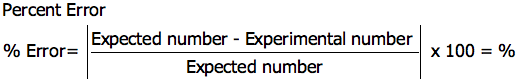
The expected number is either an accepted number found from a reputable source or a number you calculated with doing the experiment. The "experimental number" is one you get from your lab or actual measurements.
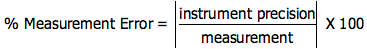
Percent error in a measurement
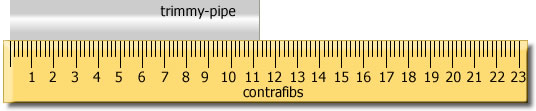
Suppose you had to measure the "trimmy pipe" of the retroincabulator, (Click here for a clever, nonsensical, video.) When looking at the precision of the this ruler you can see the trimmy pipe is greater than 11 contrafibs. Each line after the 11 mark counts as 0.2 contrafibs. The trimmer pipe is definitely 0.2 contrafibs greater than 11 but it is not 0.4. It looks like you can estimate half a mark between 0.2 and 0.4. This means the precision of the instrument is ± 0.1. The error in the measurement is found from
From this example the percent error in the measurement is
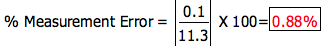
This measurement has a precision of just less than 1%.
| Example 2 - % Error |
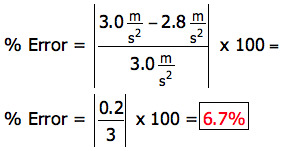
In "Car and Driver" magazine the acceleration of a bus is measured to be 3.0 m/s2. In an experiment you measure the acceleration of the same bus to be 2.8 m/s2. What is the experimental error?
The expected number is 3.0 m/s2.
The experimental number is 2.8 m/s2.
|
| Example 3 - % Error |
After doing some research you find the initial velocity, final velocity and the distance a bus travels to perform this change in speed. From the these three numbers to calculate the bus's acceleration to be 3.0 m/s2. In an experiment you measure the acceleration of the same bus to be 2.8 m/s2. What is the experimental error?
The expected number is 3.0 m/s2.
The experimental number is 2.8 m/s2.
The only difference between these two examples is how the "expected" number is acquired. Sometimes the excepted error is referred to as the "theoretical" value. |
|