Data tables consist of rows and columns. These combine to make what are called, "cells." the cell at the top of a column is called the, "header." There is no minimum or maximum to how many rows or columns are needed in a data table.
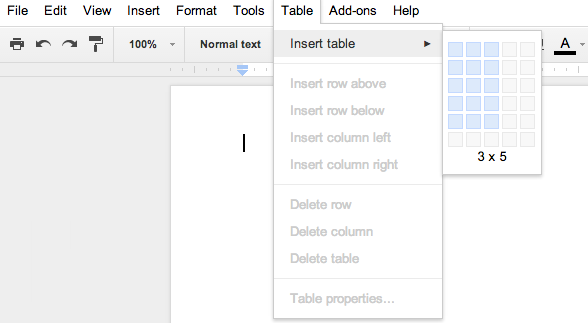
Tables are easy to insert in a GoogleDoc. From the menu item that says, "Table," choose "Insert table." Slide the cursor over to highlight the dimensions of the table. You can add and subtract rows and columns later if needed.
|
Every header should have two items.
- A descriptive label
- SI units in parenthesis
| Example Data Table |
| This is a sample of a data table form a lab that involves a car that travels 2.0 meters along a HotWheels® track. |
Time
s
|
| 0.12 |
| 0.15 |
| 0.16 |
| 0.12 |
| 0.12 |
0.10 |
| 0.11 |
| 0.13 |
| 0.10 |
0.09 |
| 0.12 |
- The label needs to be more descriptive. In this case describing more about when the time measurement started and where it ended.
- The units need to be in parenthesis.
|
|
Time to travel along track.
(s) |
| 0.12 |
| 0.15 |
| 0.16 |
| 0.12 |
| 0.12 |
0.10 |
| 0.11 |
| 0.13 |
| 0.10 |
0.09 |
| 0.12 |
- This is better. But a little more description would be helpful in the header's label.
|
|
Time to travel 2.0 m along track.
(s) |
| 0.12 |
| 0.15 |
| 0.16 |
| 0.12 |
| 0.12 |
0.10 |
| 0.11 |
| 0.13 |
| 0.10 |
0.09 |
| 0.12 |
|
When using data collected by a computer program like LoggerProtm. You do not need to retype the data table. If can be a screen shot that is pasted into the document. However, I expect to see some notes directly underneath the table that describes the columns' headers in detail if needed.
|